



Week of October 19, 2026
Published every Monday: Get a detailed snapshot of what moved the markets last week—and what to watch this week.
Market breadth returns.
AI concerns around spending, the ability to earn an acceptable return, and financing needs weighed on the technology sector. This led to weakness across most indices, with the exception of the Dow Jones Industrial Average. The Treasury market enjoyed its best week since February, with the 10-year declining to 5.08 percent.
Weekly Quick Hits
![]()
We expect updates on the housing market and several high-profile earnings reports this week.
BEYOND THE HEADLINES:
Market breadth returns.
Diversified portfolios have had a difficult time keeping up with the S&P 500 over the past few months as market leadership has narrowed. As yields on intermediate and longer-term Treasury bonds moved higher, investors flocked to large-cap growth companies that are most associated with the AI theme.
These developments have certainly caught the attention of investors. More than half of the companies in the S&P 500 have declined more than 20 percent from their all-time highs in that time. With this occurring alongside weakness in the bond market, it felt like we might be revisiting the environment we faced in 2022.
Short-term trends don’t make a market, however, and things can change quickly.
AI Concerns Grow
When certain parts of the market sell off, there are always varying opinions about why. Last week’s technology sell-off is no exception. Certainly, hotter-than-expected inflation data raised concerns about the path of interest rates and what that could mean for the parts of the market that trade at higher multiples.
At the same time, concerns have grown about whether companies can earn a return on the vast spending currently taking place to build out AI infrastructure. Those concerns would be exacerbated by any slowdown in AI revenues. The current sell-off feels like a valuation correction for a part of the market that has performed well for several years and not a fundamental change to the long-term AI outlook. But it does open a door to other parts of the investment landscape.
Better Valuations with Improving Fundamentals
The bottom 493 stocks in the S&P 500 have traded at a lower price-to-earnings ratio than the so-called Magnificent Seven (Apple, Amazon, Alphabet, Meta Platforms, Microsoft, Nvidia, and Tesla) for many years. The market divergence of the past few months caused that gap to widen. It coincided with the start of third-quarter earnings season. If analyst expectations are correct, this season will see strong breadth in earnings. Currently, 10 of 11 sectors are anticipated to report year-over-year earnings growth, with only health care expected to decline. Five of these sectors are expected to report double-digit earnings growth.
If the Magnificent Seven companies are removed from earnings growth calculations, the remaining 493 firms are expected to deliver earnings growth of more than 25 percent. Greater breadth in earnings should be welcomed by market participants. Historically, attractive valuations and improving fundamentals have drawn investor interest and attracted capital.
Diversification Has Been a Key Theme
Last week saw a rotation back into the rest of the market as the equal-weight S&P 500 outperformed the market cap–weighted index by 2.25 percent, the biggest outperformance since November 2020. This is similar to the environment that existed in the first half of the year. Through July, the Russell 1000 Value Index outperformed the Russell 1000 Growth Index by more than 20 percentage points. Over the same period, the equal-weight S&P 500 outperformed the market-cap version by more than 250 basis points (bps).
Historically, diversification has been the best way to navigate uncertainty. With several risks facing investors, diversification is doing its job.
“The current sell-off feels like a valuation correction for a part of the market that has performed well for several years and not a fundamental change to the long-term AI outlook. But it does open a door to other parts of the investment landscape.”
Report Releases: October 12–16, 2026
Consumer Price Index (CPI):
September (Wednesday)
Consumer inflation accelerated last month, with headline and core CPI rising more than expected on a year-over-year basis.
- Prior monthly CPI/core CPI growth: +0.4%/+0.3%
- Expected monthly CPI/core CPI growth: +0.6%/+0.2%
- Actual monthly CPI/core CPI growth: +0.6%/+0.3%
- Prior year-over-year CPI/core CPI growth: +3.4%/+2.4%
- Expected year-over-year CPI/core CPI growth: +3.6%/+2.5%
- Actual year-over-year CPI/core CPI growth: +3.7%/+2.6%
Retail Sales:
September (Thursday)
Retail sales continued to show signs of growth last month, with headline sales up 0.8 percent. Core sales, which strip out the impact of volatile auto and gas sales, were up a more modest 0.2 percent.
- Expected/prior month retail sales monthly change: +0.3%/+1.3%
- Actual retail sales monthly change: +0.8%
Producer Price Index (PPI):
September (Thursday)
PPI reports last month showed higher-than-expected producer inflation at both the monthly and annual levels.
- Prior monthly PPI/core PPI growth: +0.5%/+0.2%
- Expected monthly PPI/core PPI growth: +0.6%/+0.3%
- Actual monthly PPI/core PPI growth: +1.3%/+0.7%
- Prior year-over-year PPI/core PPI growth: +5.6%/+4.8%
- Expected year-over-year PPI/core PPI growth: +5.4%/+4.4%
- Actual year-over-year PPI/core PPI growth: +6.3%/+5.0%
The Takeaway
- Inflation data continues to come in above expectations at both the consumer and producer levels. These will be important data points as the Federal Reserve (Fed) meets at the end of the month.
- Despite the headwinds, consumers continued to spend money.
Financial Market Data
Equity
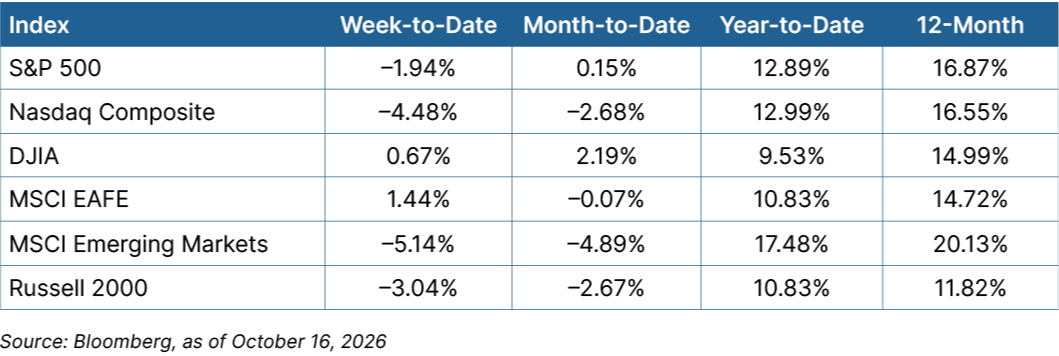
Stock indices were mostly lower, with the exception of the Dow Jones Industrial Average, which gained 0.67 percent. The technology sector, driven by a sell-off in AI-related companies, declined more than 6 percent. That led the Nasdaq Composite to decline roughly 4.5 percent. Breadth improved, however, with consumer staples and energy each rising 5 percent. The equal-weight S&P 500 had its best week of outperformance in almost six years, beating the market cap–weighted version by 2.25 percent. International markets moved higher, with developed markets up 1.44 percent, but emerging markets fell 5.14 percent.
Fixed Income
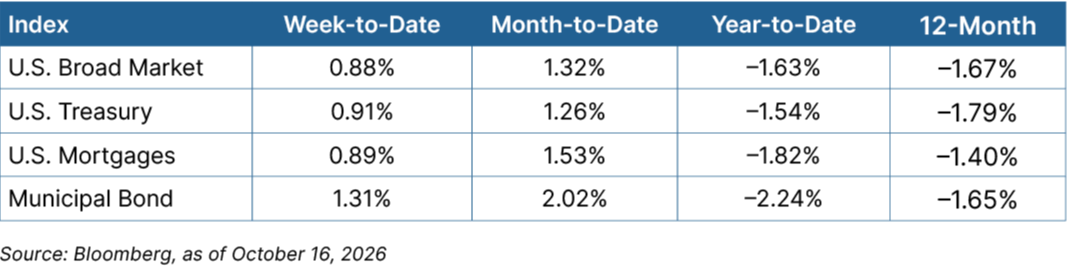
The Treasury market had its best week since February, as yields across the curve declined. The 10-year Treasury yield dipped 17 bps to close at 5.08 percent. Given the technology sell-off, the flight to quality proved a stronger catalyst than the persistently high inflation data released during the week. Most fixed income markets rallied. Core bonds, Treasuries, and mortgages each moved close to 0.9 percent, and the municipal market gained more than 1.3 percent.
The Takeaway
- Technology came under pressure on concerns about AI spending and the ability to earn a return. Market participants rotated into the rest of the market.
- Treasury markets enjoyed their best week since February on a flight-to-quality rally.
Looking Ahead
Economic data will take a back seat to earnings reports from corporate America this week. There will be several updates early in the week on the health of the housing market.
- The week kicks off on Monday with the National Association of Home Builders (NAHB) Housing Index for October. Home builder confidence is expected to fall modestly.
- On Tuesday, housing starts and building permits for September will be released. These measures of home construction are expected to be mixed month-over-month.
- Finally, third-quarter earnings season will ramp up with reports from Netflix, Meta Platforms, Tesla, GE Aerospace, and IBM.
Disclosure: This material is intended for informational/educational purposes only and should not be construed as investment advice, a solicitation, or a recommendation to buy or sell any security or investment product. Diversification does not assure a profit or protect against loss in declining markets, and diversification cannot guarantee that any objective or goal will be achieved. Please contact your financial professional for more information specific to your situation.
Bonds are subject to availability and market conditions; some have call features that may affect income. Bond prices and yields are inversely related: when the price goes up, the yield goes down, and vice versa. Market risk is a consideration if sold or redeemed prior to maturity.
Certain sections of this commentary contain forward-looking statements that are based on our reasonable expectations, estimates, projections, and assumptions. Forward-looking statements are not guarantees of future performance and involve certain risks and uncertainties, which are difficult to predict. All indices are unmanaged and are not available for direct investment by the public. Past performance is not indicative of future results. The S&P 500 is based on the average performance of the 500 industrial stocks monitored by Standard & Poor’s. The Nasdaq Composite Index measures the performance of all issues listed in the Nasdaq Stock Market, except for rights, warrants, units, and convertible debentures. The Dow Jones Industrial Average is computed by summing the prices of the stocks of 30 large companies and then dividing that total by an adjusted value, one which has been adjusted over the years to account for the effects of stock splits on the prices of the 30 companies. Dividends are reinvested to reflect the actual performance of the underlying securities. The MSCI EAFE Index is a float-adjusted market capitalization index designed to measure developed market equity performance, excluding the U.S. and Canada. The MSCI Emerging Markets Index is a market capitalization-weighted index composed of companies representative of the market structure of 26 emerging market countries in Europe, Latin America, and the Pacific Basin. The Russell 2000® Index measures the performance of the 2,000 smallest companies in the Russell 3000® Index. The Bloomberg US Aggregate Bond Index is an unmanaged market value-weighted performance benchmark for investment-grade fixed-rate debt issues, including government, corporate, asset-backed, and mortgage-backed securities with maturities of at least one year. The U.S. Treasury Index is based on the auctions of U.S. Treasury bills, or on the U.S. Treasury’s daily yield curve. The Bloomberg US Mortgage Backed Securities (MBS) Index is an unmanaged market value-weighted index of 15- and 30-year fixed-rate securities backed by mortgage pools of the Government National Mortgage Association (GNMA), Federal National Mortgage Association (Fannie Mae), and the Federal Home Loan Mortgage Corporation (FHLMC), and balloon mortgages with fixed-rate coupons. The Bloomberg US Municipal Index includes investment-grade, tax-exempt, and fixed-rate bonds with long-term maturities (greater than 2 years) selected from issues larger than $50 million. One basis point is equal to 1/100th of 1 percent, or 0.01 percent.
Authored by the Investment Research team at Commonwealth Financial Network®.
© 2026 Commonwealth Financial Network®
Let’s Talk About Your Financial Future
Whether you’re navigating a volatile market or preparing for the future, we’re here to help.